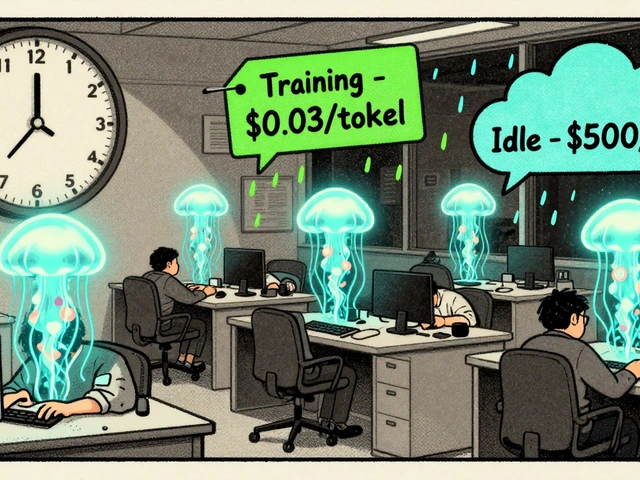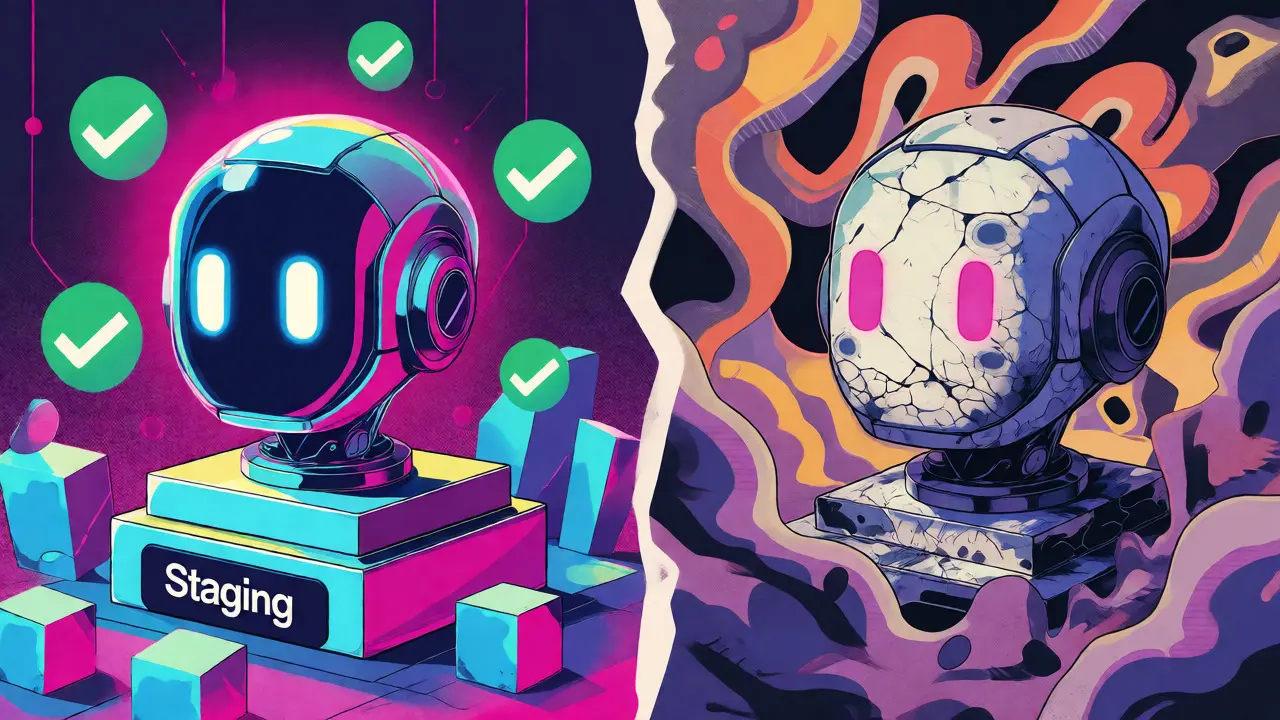
You spent weeks curating a dataset, tweaking hyperparameters, and waiting for that green checkmark on your fine-tuned large language model. It passed the evals. It looked great in staging. You pushed it to production, expecting smooth sailing. But three months later, users are complaining about weird answers, hallucinations are up, and your support tickets are piling up. What happened? Your model drifted.
Drift is the silent killer of AI deployments. It’s not a bug you can catch with unit tests; it’s a gradual decay in performance as the real world moves away from your training data. According to Forbes, 85% of AI leaders have already faced issues caused by this phenomenon. If you aren’t actively monitoring for it, you’re flying blind.
Why Your Fine-Tuned Model Starts Failing
Fine-tuning locks a model into a specific behavior pattern based on the data you gave it. But the internet-and your users-don’t stand still. When we talk about drift, we’re usually talking about two distinct but related problems: data drift and model drift.
Data drift happens when the input changes. Maybe your customer support bot was trained on questions about legacy software, but now everyone is asking about new features released last week. The statistical properties of the prompts change, confusing the model. Model drift is trickier. It’s when the relationship between inputs and outputs shifts. Perhaps user expectations changed. A response that was considered "helpful" in January might seem "too verbose" or "outdated" in June. This is concept drift, and it’s particularly nasty because the model isn't technically "wrong," it’s just out of sync with reality.
Anthropic documented a clear case where models trained on general coding queries started giving bad advice when users shifted toward newer frameworks like Bun or Astro. The model didn’t break; it just stopped knowing what it didn’t know. Without monitoring, you won’t notice until your Net Promoter Score tanks.
The Three Faces of Drift You Need to Watch
To fix drift, you first need to identify which type you’re dealing with. Most practitioners categorize it into three buckets:
- Covariate Shift: The distribution of your inputs changes. Users start using different slang, longer prompts, or ask about entirely new topics. For example, if your legal chatbot suddenly gets flooded with queries about crypto regulations instead of standard contracts, that’s covariate shift.
- Concept Drift: The definition of a "correct" answer changes. In late 2023, political sensitivities shifted rapidly. An answer that was neutral then might be seen as biased now. The model’s internal logic hasn’t changed, but the ground truth has.
- Label Drift: This is subtle. It occurs when human annotators change how they label data over time due to evolving guidelines. If your RLHF (Reinforcement Learning from Human Feedback) pipeline relies on consistent human preferences, and those preferences shift, your reward model becomes noisy.
Understanding these distinctions helps you choose the right detection method. Covariate shift is often easier to spot statistically, while concept drift requires more semantic understanding.
Technical Metrics That Actually Work
You can’t just eyeball logs. You need numbers. Traditional MLOps tools often fail here because LLM outputs are high-dimensional and unstructured. A simple accuracy metric won’t tell you if your tone has become too robotic or if your factual grounding has slipped.
Here are the industry-standard metrics for detecting drift in 2026:
| Metric | What It Measures | Typical Alert Threshold | Best Use Case |
|---|---|---|---|
| Jensen-Shannon Divergence | Difference between probability distributions of embeddings | 0.15 - 0.25 | Detecting changes in topic mix or style |
| Reward Model Score | Deviation from baseline preference scores | 15-20% drop | Monitoring alignment and helpfulness |
| K-Means Clustering | Proportion of prompts in novel clusters | 30-40% novel | Identifying new user intents or domains |
Jensen-Shannon (JS) divergence is a go-to for comparing sentence embeddings. If the JS divergence between your current week’s outputs and your historical baseline exceeds 0.25, something is off. However, don’t set thresholds too tight. Google Research noted in a 2024 whitepaper that 25-30% of detected drift signals are actually beneficial improvements. If you alert on every tiny shift, your engineers will suffer from alert fatigue and ignore the real problems.
Another powerful signal is tracking Reward Model (RM) scores. Since most modern fine-tuning pipelines use RLHF, you likely have a reward model scoring responses. If the average RM score drops by more than 15%, your model is likely generating less preferred outputs. This is a direct proxy for user satisfaction.
Building a Monitoring Pipeline
So, how do you implement this without burning through your GPU budget? Effective monitoring requires infrastructure. You need to store snapshots of production data-typically 3 to 6 months’ worth-to establish a robust baseline. Generating embeddings for every request can be expensive. Enterprise-scale setups often require 8-16 NVIDIA A100 GPUs just for the analytics pipeline, capable of processing tens of thousands of requests per second.
Start small. You don’t need to monitor everything at once. Begin by establishing a baseline using 10,000 to 50,000 representative samples from your initial launch. Then, implement a tiered alerting system:
- Tier 1 (Critical): Performance degradation >15%. Trigger an immediate rollback or emergency review.
- Tier 2 (Warning): Degradation between 5-15%. Add to a weekly review queue for potential retraining.
- Tier 3 (Info): Minor fluctuations. Log for long-term trend analysis.
Integration with existing MLOps platforms like MLflow or Weights & Biases is crucial. Gartner estimates that integrating custom drift monitoring into enterprise stacks takes 8-12 weeks. Plan for this engineering overhead.
Common Pitfalls and False Positives
Not all drift is bad. Sometimes, your model is getting better, or user behavior is legitimately changing. A common horror story comes from HackerNews, where one team spent two weeks investigating a "concept drift" that turned out to be legitimate user behavior change. They wasted $18,000 in engineering time chasing a ghost.
How do you distinguish between noise and signal? Context matters. If your JS divergence spikes because users are suddenly asking about a viral news event, that’s not model failure-that’s successful adaptation. The key is correlating drift metrics with business outcomes. Are support tickets rising? Is conversion dropping? If the metrics move but the business impact doesn’t, you might be over-monitoring.
Also, beware of the feedback delay. Meta’s research on Llama-3 monitoring highlighted a critical weakness: most systems detect concept drift 2-4 weeks after it begins. By the time you see the alert, users have already had a bad experience. To mitigate this, look for leading indicators like sudden changes in prompt length or complexity before waiting for full evaluation cycles.
The Cost of Ignoring Drift
Is it worth the investment? Consider the financial stakes. Professor Percy Liang from Stanford estimates that undetected drift costs enterprises an average of $1.2 million per incident due to reputational damage and remediation. For regulated industries like finance, the stakes are even higher. NYDFS requires financial institutions to monitor for material performance degradation, defined as a >10% accuracy drop. Missing this can lead to compliance violations.
A major financial institution recently used JS divergence monitoring to catch a 22% degradation in financial advice quality before users noticed. This proactive step prevented an estimated $2.3 million in potential compliance fines. Compare that to the cost of open-source tools like NannyML or commercial solutions ranging from $25-$75 per 1,000 monitored requests. The ROI is clear.
As we move further into 2026, drift monitoring is shifting from a nice-to-have to a non-negotiable requirement. With the EU AI Act enforcing continuous monitoring standards, organizations that treat their LLMs as static artifacts will fall behind. Treat your model as a living product that needs constant care, feeding, and observation.
How quickly does a fine-tuned LLM typically degrade?
According to Dr. Sarah Bird of Microsoft, fine-tuned LLMs can degrade at approximately 3-5% accuracy per month in real-world applications without intervention. This rate varies significantly depending on the volatility of the domain and the frequency of new information entering the ecosystem.
What is the difference between data drift and model drift?
Data drift refers to changes in the statistical properties of the input data (prompts), such as new topics or language patterns. Model drift refers to the degradation of the model's predictive power itself, often due to the relationship between inputs and desired outputs changing over time (concept drift). Data drift causes the model to see unfamiliar inputs, while model drift means the model's learned associations are no longer valid.
Do I need specialized hardware for drift monitoring?
For small-scale deployments, CPU-based embedding generation may suffice. However, for enterprise-scale operations processing 10,000+ requests per second, dedicated infrastructure is required. This often involves 8-16 NVIDIA A100 GPUs to handle the computational load of generating embeddings and running statistical comparisons in near real-time.
How do I avoid false positives in drift detection?
Use tiered alerting systems and correlate technical metrics with business KPIs. Set thresholds conservatively (e.g., JS divergence > 0.25) to reduce noise. Additionally, implement manual review queues for minor drift alerts rather than triggering automatic rollbacks. Distinguishing between genuine drift and beneficial model evolution requires context that pure statistics cannot provide.
Which open-source tools are best for LLM drift monitoring?
NannyML is a popular open-source alternative that requires significant engineering resources but offers zero licensing costs. OpenAI's 'DriftShield' framework, released in late 2025, uses contrastive learning to detect semantic drift and reduces false positives by 29%. Hugging Face also integrates automatic drift detection into its Inference Endpoints platform.