You have the numbers. You ran your Large Language Model against a dozen benchmarks, and now you are staring at a spreadsheet that looks like it was generated by a robot with no sense of design. Rows of accuracy scores, perplexity metrics, and latency times stretch on forever. But here is the problem: raw numbers lie by omission. They don't show you *why* a model failed or *where* it hallucinated. This is where visualization techniques for LLM evaluation results come in. It’s not just about making pretty graphs; it’s about turning opaque data into actionable insights so you can actually understand what your model is doing.
The field has exploded since 2022 because we moved from simple chatbots to complex systems that need rigorous assessment. If you are still relying on bar charts alone, you are missing half the story. Let’s break down how to visualize these results effectively, avoiding the common traps that lead to misleading conclusions.
Why Standard Charts Often Fail LLMs
Most people start with bar charts. And honestly? They work. A 2024 analysis of 157 papers showed that bar charts account for about 63% of all LLM evaluation visualizations. Why? Because they are easy to read. If Model A scores 89.7% and Model B scores 82.3%, you know who won. Done.
But here is the catch: bar charts are terrible at showing uncertainty. Modern evaluations often include confidence intervals-those little error bars that tell you if the difference between two models is real or just noise. Yet, studies show that 78% of current visualization techniques fail to adequately represent this uncertainty. When you ignore those error bars, you might pick a model that isn’t actually better, just luckier on that specific test set. Dr. Eva K. Mueller, a visualization lead at Anthropic, pointed out that the lack of standardized protocols for showing this uncertainty creates chaos when comparing studies. So, if you use a bar chart, make sure you add those error bars. Don’t hide them.
Token Heatmaps: Seeing What the Model Sees
If you want to diagnose *why* a model got a question wrong, look at the tokens. Token heatmaps are one of the most powerful tools for this. They use color gradients to highlight which parts of the input text influenced the output the most. Typically, red indicates high importance (weights above 0.8) and blue shows low importance (below 0.2).
Imagine you ask a model to summarize a legal contract. A heatmap might show bright red over the clause about liability, indicating the model focused heavily there. But if the summary misses a key date, and the heatmap shows that date as pale blue, you know the model ignored it. This is crucial for debugging. However, there is a steep learning curve. Novice users misinterpret about 41% of heatmap visualizations because they assume every red spot means "correct." It doesn’t. It means "attended to." The model could attend to the wrong thing and still be wrong. Use these maps to trace attention pathways, not just to validate answers.
Scatter Plots for Trade-Off Analysis
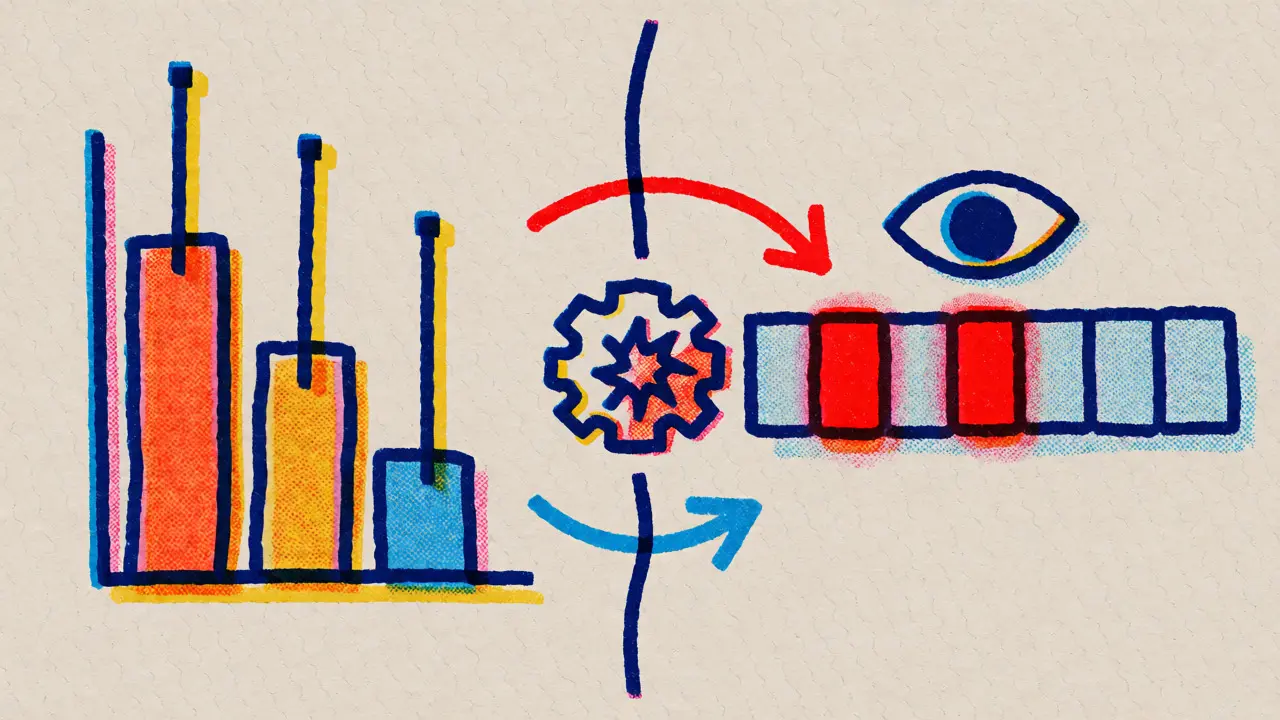
Performance isn’t free. Usually, if you want higher accuracy, you pay with slower inference time. Scatter plots are the best way to visualize this trade-off. Plot accuracy on the Y-axis and inference time (or cost) on the X-axis. Each dot represents a model or a configuration.
For example, in recent tests, GPT-4o demonstrated 89.7% accuracy at 120ms inference time, while Claude 3 hit 82.3% at 150ms. On a scatter plot, you can instantly see which models sit in the "sweet spot"-high accuracy, low latency. Scatter plots excel here, with users identifying relationships correctly 89.4% of the time compared to just 63.2% with tables. But beware: once you try to add a third dimension, like fairness scores or robustness, the plot gets messy. If you have more than two key metrics, consider using bubble size to encode the third variable, but keep it simple.
| Technique | Best For | Effectiveness Score | Common Pitfall |
|---|---|---|---|
| Bar Charts | Comparing overall benchmark scores | High for speed, Low for nuance | Hiding uncertainty intervals |
| Token Heatmaps | Debugging attention mechanisms | 92.1% for behavior ID | Misinterpreting attention as correctness |
| Scatter Plots | Accuracy vs. Latency/Cost trade-offs | 89.4% for correlation ID | Overcrowding with >2 dimensions |
| Parallel Coordinates | Multi-dimensional metric comparison | High for interactivity | Visual clutter with >300 points |
Interactive Tools: Beyond Static Images
Static images are fine for a quick blog post, but if you are an engineer tuning a model, you need interaction. Tools like EvaLLM and LIDA allow you to filter and zoom. EvaLLM uses parallel coordinates to show up to 12 metrics simultaneously. You can drag a slider to filter only models with accuracy above 80% and see how their latency changes.
However, interactivity comes with a cost. These tools require WebGL-enabled browsers and can slow down if you load too many data points. Users report that EvaLLM becomes unusable with more than 300 evaluation points due to visual clutter. Also, building these custom views takes time. Data scientists spend 15-25 hours per week creating these visualizations. If you aren’t comfortable with Python libraries like Plotly or Matplotlib, you might struggle. But the payoff is huge: interactive visualizations lead to 27.8% higher user satisfaction because you can explore the "what-if" scenarios directly.
Standardization and Future Trends
Right now, everyone does it differently. One team uses green for good, another uses blue. One includes error bars, another doesn’t. This makes cross-study comparison a nightmare. Researchers at Georgia Tech and IIT Delhi are pushing for standardization, including a new benchmark called VisEval to test how well models themselves can generate correct visualizations. Interestingly, GPT-4o achieves 89.7% accuracy on common chart types but drops to 42.3% on complex ones like radar charts. This tells us that even AI struggles to interpret its own evaluation data visually without help.
Looking ahead, expect adaptive visualization systems. By 2027, experts predict that 92% of LLM evaluations will use interactive, multi-dimensional visuals as standard. We are moving away from static reports toward dynamic dashboards that automatically select the best chart type based on the data structure. If you are building an evaluation pipeline today, invest in tools that support this shift. Open-source options like LIDA and NL4DV are great starting points, though commercial platforms like Weights & Biases are catching up fast for enterprise needs.
Practical Tips for Better Visuals
- Show Uncertainty: Always include confidence intervals. If you can’t, note that the differences might not be statistically significant.
- Limit Dimensions: Stick to 2-3 key metrics per view. Use separate charts for others rather than cramming everything into one complex graphic.
- Color Consistency: Pick a palette and stick to it across all reports. Inconsistent colors confuse stakeholders more than bad data does.
- Annotate Key Points: Don’t make users guess why a spike happened. Add text labels explaining outliers or major shifts.
What is the most effective visualization for comparing multiple LLMs?
Bar charts remain the most prevalent technique, accounting for roughly 63% of evaluations, because they clearly display comparative performance across benchmarks. However, for deeper analysis, scatter plots are superior for revealing trade-offs between metrics like accuracy and latency.
How do token heatmaps help in LLM evaluation?
Token heatmaps visualize the attention weights assigned by the model to different tokens in the input sequence. Red areas indicate high importance (values >0.8), helping researchers diagnose whether the model focused on relevant information or ignored critical context, which aids in debugging errors.
Why are uncertainty intervals important in LLM visualizations?
Uncertainty intervals show the reliability of evaluation scores. Without them, small differences between models might appear significant when they are actually within the margin of error. Current studies indicate that 78% of visualizations fail to show this, leading to potentially flawed model selection decisions.
What tools are recommended for interactive LLM evaluation visualization?
Open-source tools like LIDA, NL4DV, and EvaLLM are popular for academic and individual use. EvaLLM supports parallel coordinates for multi-metric analysis, while LIDA generates visualizations automatically. For enterprises, platforms like Weights & Biases offer integrated MLOps visualization capabilities.
Can AI models accurately generate their own evaluation visualizations?
Not perfectly yet. Benchmarks like VisEval show that while GPT-4o achieves 89.7% accuracy on simple charts, its performance drops to 42.3% on complex visualizations like radar charts. Human oversight remains necessary to ensure accurate interpretation.