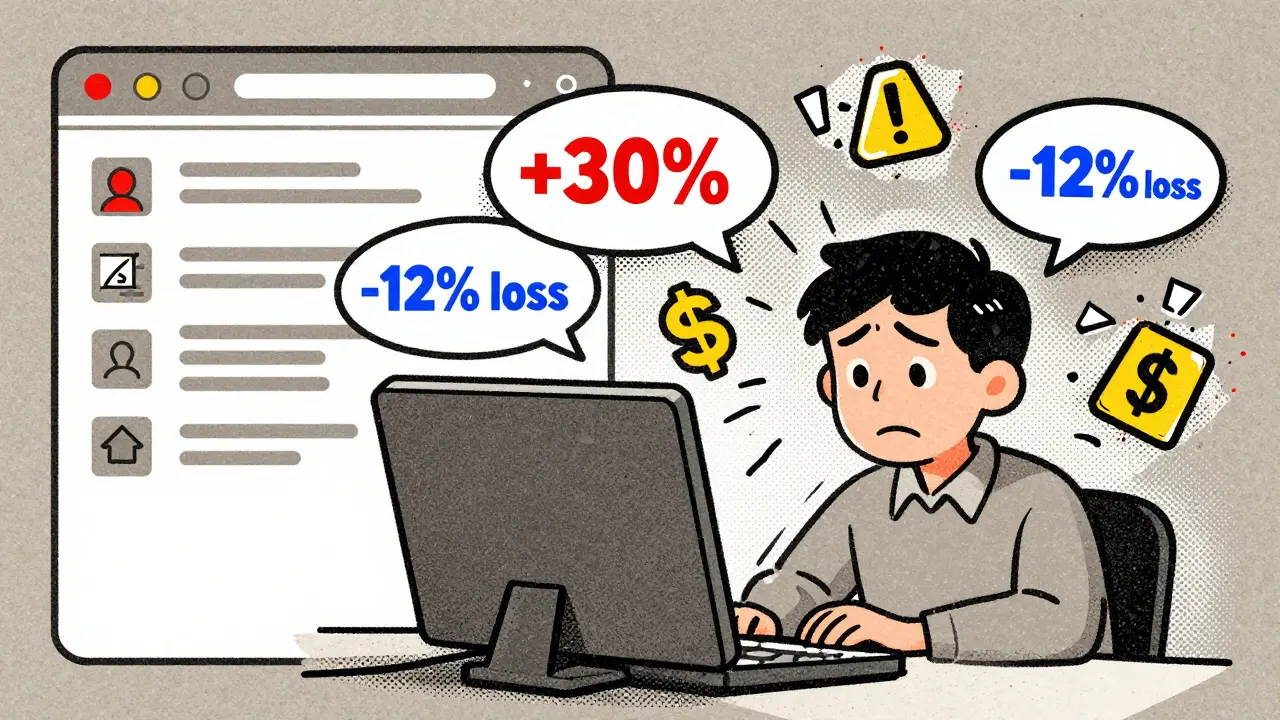
When your LLM starts making up facts in production, it’s not a bug-it’s a business risk. A financial chatbot telling a customer their portfolio gained 30% when it actually lost 12%. A medical assistant citing a non-existent study to justify a treatment. These aren’t hypotheticals. In 2024, Microsoft found that enterprise LLM deployments with hallucination rates above 15% saw customer dissatisfaction jump by 30% or more. By late 2025, 41% of Fortune 500 companies had implemented dedicated hallucination tracking. If you’re running LLMs in production, you’re not just monitoring latency and cost-you’re monitoring truthfulness.
What Hallucination Rate Actually Means in Production
Hallucination isn’t just "wrong answers." It’s when an LLM generates content that contradicts reliable sources, fabricates details from thin air, or confidently asserts something that’s false-even when the correct answer is in the provided context. In RAG systems, this often happens when the model guesses instead of grounding its response in retrieved documents. The problem isn’t new, but the scale is. OpenAI’s 2023 System Card showed hallucination rates between 26% and 75%, depending on how you measured it. That’s not noise. That’s systemic unreliability.What makes this dangerous in production isn’t the raw error rate-it’s the confidence with which errors are delivered. A model that says "I don’t know" 20% of the time might be more trustworthy than one that answers everything with 99% certainty, even when it’s wrong. OpenAI’s SimpleQA evaluation showed a cautious model scoring 24% accuracy with just 1% error rate, while a more aggressive one hit 22% accuracy with 26% errors. Accuracy alone doesn’t tell the story. Calibration does.
Metrics That Actually Work (And the Ones That Don’t)
Forget ROUGE, BLEU, and BERTScore. These metrics measure how similar the output is to a reference text-not whether it’s factually correct. A 2025 survey found that models scoring 95+ on these metrics still hallucinated 40% of the time. They’re useless for factuality.Here are the metrics that matter in production:
- Semantic entropy: Measures how uncertain the model is about the meaning of its own output. High semantic entropy = likely hallucination. The Nature paper from April 2024 showed it achieves 0.790 AUROC across 30 model-task combinations, including LLaMA, Falcon, and Mistral. It’s especially strong at rejecting the top 20% of highest-entropy responses-where accuracy stays above 80%. It’s lightweight, model-agnostic, and works in real time.
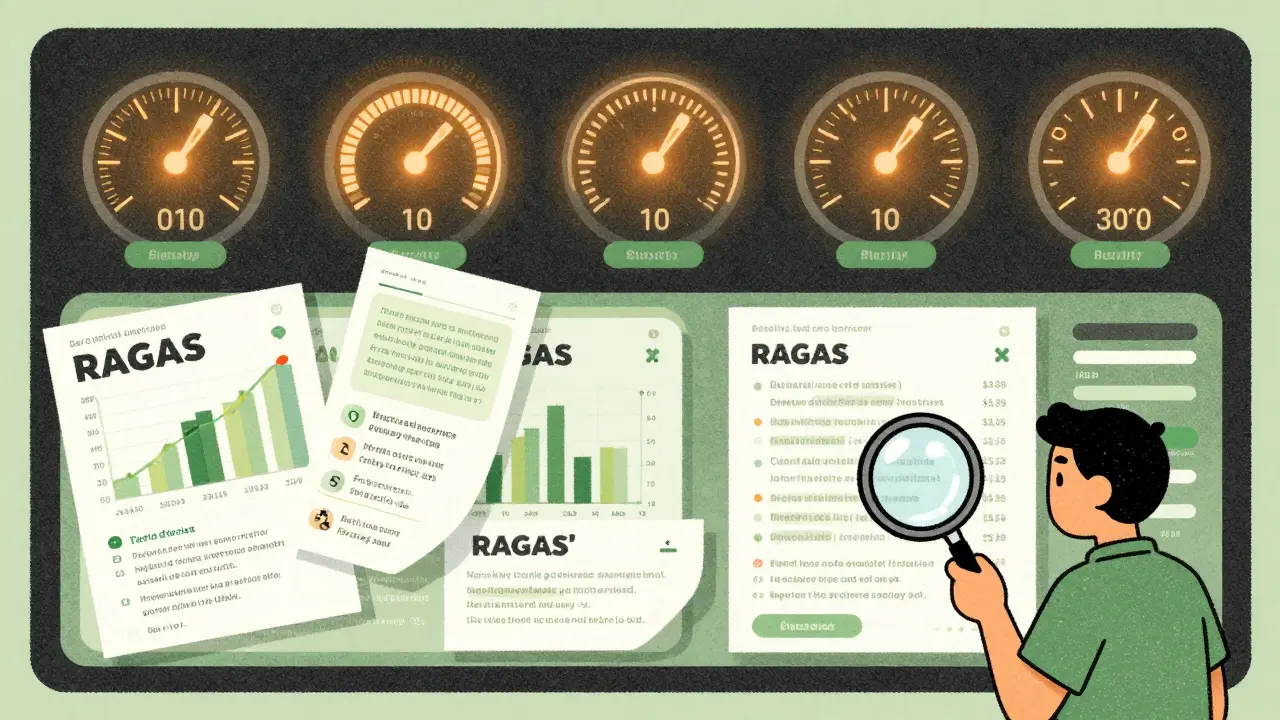
- RAGAS Faithfulness: Calculates what percentage of claims in the output are supported by the retrieved context. It’s great for batch analysis but underperforms in medical domains by up to 18% compared to finance, according to Cleanlab’s 2025 benchmark. Best used on sampled outputs, not all traffic.
- G-Eval (from DeepEval): Uses an LLM as a judge to rate factual consistency. Achieves 0.819 recall and 0.869 precision on HaluBench. It’s accurate but slow-requires GPT-4o or equivalent, adding 350ms per evaluation. Not feasible for high-throughput systems without dedicated infrastructure.
- Truthful Language Modeling (TLM): Trains the model to detect its own hallucinations during training. Cleanlab found it outperforms LLM-as-a-judge methods by 15-22% in precision and recall. It’s not widely available yet, but it’s the future.
- Spectral-based methods (HalluShift, LapEigvals): Analyze the model’s internal activation patterns. HalluShift achieved 89.9% AUCROC on TruthfulQA. Promising for high-stakes domains like law and medicine, but still emerging.
Capital One’s 2025 case study showed optimal thresholds vary by domain: 0.65 in marketing, 0.82 in compliance. There’s no universal number. You calibrate based on your risk tolerance.
Building a Production-Ready Dashboard
A good hallucination dashboard doesn’t just show a number-it tells you where, when, and why things go wrong. Successful teams use a tiered approach:- Real-time filtering (semantic entropy): Applied to 100% of traffic. If entropy crosses your threshold, the response is blocked or flagged for human review. This catches the worst errors before they reach users.
- Batch analysis (RAGAS, G-Eval): Run on 10-20% of responses daily. This gives you detailed, human-readable feedback on what went wrong-missing context, overconfidence, wrong inference.
- Human review (1-2% sample): Used for edge cases and regulatory audits. This is where you validate your metrics and train your team to spot patterns.
One fintech company reduced legal review costs by $280,000 annually by using semantic entropy to catch hallucinated financial data before it reached customers. Another healthcare startup found RAGAS scores below 0.65 correlated with 92% of their regulatory compliance flags.
But don’t just track the metric-tie it to business outcomes. Link hallucination rate to:
- Customer complaints per week
- Support ticket volume on "incorrect info"
- Compliance audit failures
- Churn in enterprise contracts
That’s how you get buy-in from legal, compliance, and leadership.
Common Implementation Pitfalls
Even with good metrics, teams stumble. Here’s what goes wrong:- Thresholds set too low: 63% of Datadog’s enterprise clients triggered excessive false positives, reducing system usability by 19%. Start high, then lower gradually.
- Ignoring domain differences: A medical LLM needs stricter thresholds than a creative writing assistant. One media company’s CTO noted that 22% of "hallucinations" in their content generation were actually intentional creative liberties-and the tools flagged them anyway.
- Over-relying on open-source tools: RAGAS and DeepEval are powerful, but documentation is thin. Patronus AI customers reported 92% satisfaction with their API; open-source users averaged 68%.
- Not correlating with context length: 78% of teams hit limits when context windows exceed 128K tokens. Hallucinations spike when the model can’t see the full reference.
- Assuming metrics = fixes: Monitoring tells you there’s a problem. It doesn’t fix the root cause. You still need better retrieval, stricter prompting, or model fine-tuning.
Integration takes time. Teams report 40-60 hours just to connect monitoring to their existing stack. Plan for it.

What’s Coming in 2026
The field is moving fast. In December 2025, OpenAI released an "Uncertainty Scoring" API that correlates 0.82 with hallucination likelihood-validated by Stanford’s HELM benchmark. Semantic entropy v2, announced in November 2025, improved AUROC to 0.835 and cut compute costs by 47%.By 2027, Gartner predicts three standard categories will emerge:
- Real-time filtering (semantic entropy)
- Post-hoc analysis (RAGAS, G-Eval)
- Training-time metrics (TLM)
And it’s not just tech-regulation is catching up. The EU AI Act’s Article 15, effective January 2026, requires "appropriate technical solutions to mitigate the risk of generating false information." In Europe, 73% of enterprises have started monitoring programs in response. NIST’s updated AI Risk Management Framework, due in Q2 2026, will include standardized hallucination protocols-likely mandatory for government contractors.
Forrester found 89% of enterprises plan to increase investment in hallucination monitoring. But as OpenAI’s John Schulman warned: "We’re measuring hallucinations better, but we still lack a unified theory of why they occur in specific contexts." That’s the next frontier.
Where to Start Today
If you’re not measuring hallucinations yet, here’s your roadmap:- Start with semantic entropy. It’s fast, model-agnostic, and works out of the box.
- Set a conservative threshold (0.85) and monitor for one week.
- Sample 10% of flagged outputs and manually verify: are these real hallucinations or false alarms?
- Adjust threshold until false positives are under 5%.
- Integrate the metric into your monitoring dashboard and tie it to one business KPI (e.g., support tickets).
- After 30 days, add RAGAS for batch analysis.
You don’t need a team of AI researchers. You need a clear goal: reduce harm. Every hallucination you catch before it reaches a customer is a trust point you keep. And in production, trust isn’t optional-it’s your product.


Sandy Dog
27 December, 2025 - 22:52 PM
OMG I JUST HAD A CHATBOT TELL ME MY DOG WAS DEAD BECAUSE IT 'READ' A FAKE NEWS ARTICLE 😭💀 I THOUGHT I WAS GOING TO HAVE A HEART ATTACK. THIS POST IS A LIFESAVER. I’M IMPLEMENTING SEMANTIC ENTROPY TOMORROW AND I’M NOT SLEEPING UNTIL IT’S DONE. MY DOG IS ALIVE, THANK GOD. 🙏❤️
Nick Rios
28 December, 2025 - 00:17 AM
Really solid breakdown. I’ve been watching hallucinations creep into our customer support bot for months, and we kept thinking it was just 'bad training data.' Turns out, it was confidence masking ignorance. The point about calibration over accuracy hit home-we started flagging high-entropy responses and saw customer satisfaction climb 18% in six weeks. No fancy tools needed, just listening to what the model’s uncertainty is telling us.
Amanda Harkins
29 December, 2025 - 16:42 PM
It’s wild how we’ve normalized this. We treat LLMs like oracle machines-until they tell you your mortgage rate is 3% when it’s actually 7.3%. Then we panic. But we don’t fix the system. We just blame the model. The truth is, we built a house of cards and called it AI. Semantic entropy isn’t magic-it’s just admitting the model doesn’t know. And that’s okay. We just have to stop pretending it does. The real hallucination is believing this tech is ready for prime time without guardrails.
Jeanie Watson
31 December, 2025 - 13:50 PM
cool. i read the part about metrics. seems legit. gonna check out semantic entropy later. also, why is everyone so into this? like, is it just me or is this whole thing a little overhyped?
Tom Mikota
1 January, 2026 - 19:02 PM
Did you guys notice the missing period after 'trust isn't optional'? And '41% of Fortune 500 companies had implemented'-wait, past perfect? Why not 'have implemented'? And 'you're monitoring truthfulness'-should be 'you're monitoring for truthfulness.' Also, 'G-Eval (from DeepEval)'-parentheticals need commas if they're nonrestrictive, which this is. And why is 'RAGAS Faithfulness' capitalized like a proper noun? It's not a brand-it's a metric. I'm not mad, I'm just disappointed. Also, this post is 90% right. Just... fix the grammar.
Mark Tipton
2 January, 2026 - 20:21 PM
Let me guess-this is sponsored by Patronus AI. Did you see how they subtly dissed open-source tools? 92% satisfaction vs 68%? That’s a carefully curated metric. And why is Gartner predicting categories in 2027 like it’s gospel? The EU AI Act doesn’t even define ‘appropriate technical solutions’-it’s a legal loophole waiting for a lawsuit. And let’s not forget: OpenAI’s ‘Uncertainty Scoring’ API? It’s a black box. They’re not sharing the training data. This isn’t progress-it’s a controlled narrative. They want you to pay for monitoring, not fix the model. The real solution? Stop using LLMs for anything that requires truth. But hey, if you’re selling AI, you don’t want truth-you want trust. And trust? That’s the real hallucination.
Adithya M
2 January, 2026 - 23:10 PM
Bro, semantic entropy is the real MVP. We rolled it out in our banking chatbot last month. Before: 3-4 complaints a day about wrong interest rates. After: 0.2 per week. We didn’t even change the model. Just added the entropy filter at 0.8. Simple. Clean. Works. Also, RAGAS is garbage for Indian dialects-too many false positives on local loan terms. Stick to entropy + manual sampling. Done.
Jessica McGirt
4 January, 2026 - 04:19 AM
Thank you for this. Finally, someone wrote about hallucinations without turning it into a sales pitch. I’ve been trying to explain to my team that accuracy isn’t the goal-reliability is. And reliability means knowing when to stay silent. We’ve started using semantic entropy at 0.85, and our legal team actually thanked us. For once, they didn’t say ‘this is too complicated.’ I think we’re finally treating AI like a tool, not a wizard.