
Running a large language model (LLM) in production isn’t like running a website. You can’t just throw more CPUs at it when traffic spikes. If you do, you’ll burn through your budget before lunch-and still get slow responses. The real challenge? Autoscaling LLM services in a way that keeps latency low, costs under control, and infrastructure from screaming for mercy. This isn’t theory. It’s what teams at Google, Anthropic, and Fortune 500 companies wrestle with every day.
Why Traditional Autoscaling Fails for LLMs
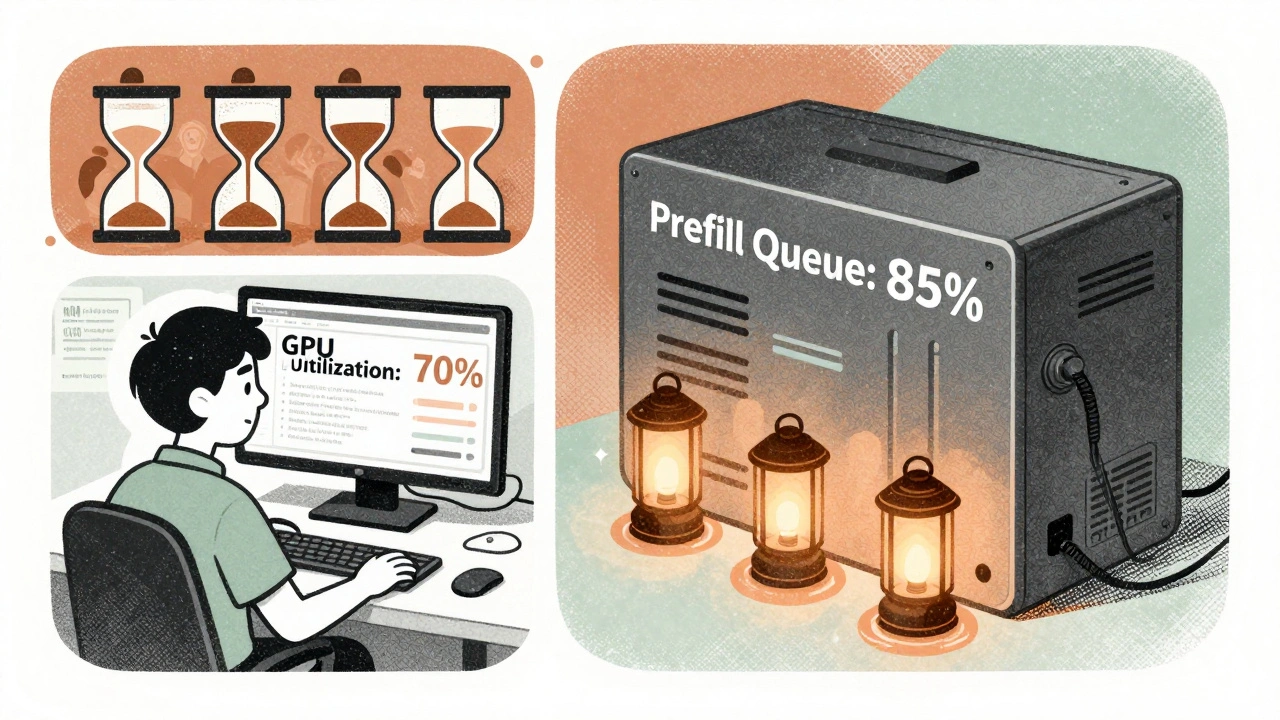
Most cloud autoscaling tools were built for web apps: simple HTTP requests, fast start times, and predictable resource use. LLMs don’t play by those rules. A single inference request can use 10GB of memory. A burst of 50 requests might need 10 GPUs. And if you scale too slowly, users wait. Too fast, and you’re paying for idle GPUs overnight. The problem isn’t just volume-it’s timing. LLMs rely on batching. If you get 3 requests at once, you can process them together and save 40% on compute. But if they arrive one by one, you’re wasting hardware. Traditional CPU or GPU utilization metrics miss this entirely. A GPU might look 60% busy, but if your prefill queue is full, every new request is stuck waiting.The Three Key Signals That Actually Matter
Forget CPU, memory, or even GPU utilization. For LLMs, three metrics tell you what’s really happening:- Prefill queue size: This is the number of requests waiting to be processed before the model starts generating output. When this queue hits 85% of max capacity, latency spikes. Google’s data shows a 230% increase in 95th percentile latency when the queue is over 70% full. This is your early warning system.
- Slots_used percentage: In systems using continuous batching (like JetStream or vLLM), this shows how many processing slots are occupied. If slots_used hits 90%, you’re at capacity. Scaling here gives you faster response than waiting for queue buildup.
- TPU/HBM usage: High Bandwidth Memory on TPUs or VRAM on GPUs directly correlates with tokens processed per second. Google found a 92% correlation between HBM usage and actual throughput. CPU and GPU utilization? Only 63%. HBM tells you what’s actually happening.
These aren’t guesses. They’re measurements from real LLM serving stacks. Use the wrong one, and you’re flying blind.
Choosing the Right Policy for Your Workload
Not all LLM services are the same. Your scaling policy should match your use case.- Real-time chatbots (sub-second latency): Use slots_used. If you need responses under 500ms, you can’t wait for queues to fill. CloudOptimo found this cuts 99th percentile latency by 38% compared to queue-based scaling. But it costs 15% more because you’re scaling up sooner.
- Internal scoring or batch processing (2-5 second tolerance): Use prefill queue size. Google reports 27% higher throughput per dollar here. You can wait a little longer, so you scale less often and save big.
- Nightly model evaluations (no real-time pressure): Use aggressive scale-in. If GPU utilization drops below 35% for 8 minutes, shut it down. Nexastack saw 68% cost savings this way. Spot instances? Even better.
There’s no one-size-fits-all. A customer service bot needs speed. A report generator needs efficiency. Match your policy to your budget and your users’ patience.
The Cold Start Problem (And How to Fix It)
Scaling up sounds great-until you realize it takes 2 minutes to boot a new LLM replica. Kubernetes starts a container, loads a 15GB model into memory, and only then can it accept requests. During that time, your queue grows. Users get timeouts. You lose trust. Standard deployments: 112-187 seconds to warm up. That’s too long. The fix? Pre-warmed containers. Keep a few replicas idle but loaded. When traffic spikes, you just route to them. No loading. No waiting. Google and Baseten use this. It cuts warm-up time to 23-37 seconds. But it costs 18-22% more to run those idle replicas. You’re trading money for reliability. If your users expect instant replies, you pay. If you can tolerate a 1-second delay, maybe you don’t need them.Implementation: What It Really Takes
Setting this up isn’t a weekend project. You need:- Kubernetes with Horizontal Pod Autoscaler (HPA)
- Prometheus to collect custom metrics
- Metrics Server and Prometheus Adapter to expose them to HPA
- Custom exporters from your LLM serving framework (vLLM, TGI, or TensorRT-LLM)
Google’s internal data says it takes 6.2 weeks on average for teams with Kubernetes experience. For most, it’s closer to 8-12 weeks. MIT researchers found that’s a major barrier for startups without dedicated MLOps teams.
And the pitfalls? They’re everywhere:
- Scaling on 70% queue utilization instead of 85%? You’ll over-provision and still fail under load.
- Sampling metrics every 30 seconds? Too slow. You’ll miss spikes. Aim for 5-10 seconds.
- Cooldown periods under 5 minutes? You’ll get scaling thrashing-up, down, up, down-wasting money and stability.
One Reddit user cut costs by 42% after 3 weeks of tuning. Another startup on HackerNews saw 22% higher costs in their first month because their scale-out threshold was too low. They didn’t know what they were measuring.

What’s Changing in 2025
The tools are getting smarter.- Predictive scaling: Google’s new system uses historical traffic to predict spikes. If your usage always jumps at 9 a.m., it starts scaling up at 8:45. Reduces latency spikes by 63%.
- Cost-aware autoscaling: Systems now check real-time spot instance prices. If AWS is cheaper than GCP, it shifts workloads. CloudOptimo saw 44% savings on batch workloads.
- Built-in support: Kserve 0.12 (Oct 2024) now natively supports prefill queue metrics. No more custom exporters. Just enable it.
By 2025, 75% of enterprise LLM deployments will use multi-metric policies. Only 18% did in early 2024. The market is catching up.
Who’s Winning and Who’s Losing
Cloud providers (AWS SageMaker, Azure ML) offer basic autoscaling. But they’re generic. Specialized platforms like Baseten, OctoAI, and Banana are winning because they’re built for LLMs. Comet ML benchmarks show they’re 22-35% more efficient. Gartner found that 68% of Fortune 500 companies use some form of autoscaling-but only 29% are happy with the cost-performance balance. Why? Most are still using CPU-based scaling or poorly tuned queue thresholds. The winners? Teams that:- Measure prefill queue size, not GPU usage
- Pre-warm replicas for real-time apps
- Use spot instances for batch jobs
- Wait until 85% queue utilization before scaling
The losers? Those who treat LLMs like web servers. They pay more. They get slower. They lose trust.
Final Advice: Start Simple, Scale Smart
Don’t try to build a predictive, cost-aware, multi-metric system on day one. Start here:- Instrument your LLM server to expose prefill queue size.
- Set autoscaling to trigger at 85% queue utilization.
- Set cooldown to 10 minutes.
- Monitor for 2 weeks. See how often it scales.
- Then, add pre-warmed replicas if latency is still spiking.
- Finally, explore cost-aware scaling if you run batch workloads.
LLM autoscaling isn’t about fancy AI. It’s about measuring the right thing, setting the right threshold, and not overcomplicating it. The math is simple: more queue = more wait. More replicas = more cost. Find the balance. Your budget-and your users-will thank you.
What’s the best metric to use for LLM autoscaling?
For most production LLM services, prefill queue size is the best starting point. It directly correlates with user latency and is a leading indicator of capacity issues. Google Cloud and CloudOptimo both recommend it for cost-efficient throughput. For real-time apps where every millisecond counts, slots_used is better. For batch workloads, combine both with hardware utilization.
Can I use CPU or GPU utilization to autoscale LLMs?
No, not reliably. CPU and GPU utilization show only 63% correlation with actual LLM throughput. A GPU might be at 70% utilization but still have a full prefill queue, meaning new requests are waiting. You’ll scale too late or too late. Use prefill queue size, slots_used, or HBM/VRAM usage instead.
How long does it take to implement LLM autoscaling?
For teams with Kubernetes and Prometheus experience, expect 6-12 weeks. This includes setting up custom exporters, tuning thresholds, testing scaling behavior, and avoiding thrashing. Startups without MLOps teams often take longer. Platforms like Kserve 0.12 and Baseten reduce this to 2-4 weeks by offering built-in metrics.
Is autoscaling worth the cost and complexity?
Absolutely-if you’re running LLMs at scale. CloudOptimo reports 30-60% cost reductions while maintaining SLAs. Google estimates poor autoscaling can double your costs and still fail to meet latency targets. For any business running more than a few hundred inferences per day, the ROI is clear. The cost isn’t in the tooling-it’s in the mistakes from not doing it right.
What’s the biggest mistake people make with LLM autoscaling?
Scaling on the wrong metrics-like CPU or GPU usage. The second biggest? Setting thresholds too low (e.g., scaling at 60% queue usage). That leads to over-provisioning and higher costs. The third? Ignoring cooldown periods. Too short, and you get scaling thrashing. Too long, and you miss spikes. Start with 85% queue utilization and a 10-minute cooldown. Test. Adjust.


Rob D
10 December, 2025 - 08:54 AM
Let me tell you something, folks - if you're still using GPU utilization to scale LLMs, you're basically using a compass to navigate a hurricane. Prefill queue size? That's your goddamn radar. Google's been screaming this from the rooftops for years and yet here we are, startups still running on fumes and hope. You want low latency? You want to not get roasted by your CTO? Stop guessing. Start measuring. 85% queue threshold. 10-minute cooldown. Done. No more excuses.
Franklin Hooper
11 December, 2025 - 14:36 PM
While I appreciate the general thrust of this analysis, one must acknowledge the inherent imprecision in the term 'slots_used.' The metric is context-dependent, varying across vLLM, JetStream, and proprietary implementations. Without explicit normalization or calibration against baseline throughput, its utility as a universal scaling signal remains questionable. One might argue that HBM usage, while more granular, introduces latency in sampling frequency that may not align with real-time requirements.
Jess Ciro
13 December, 2025 - 07:11 AM
They don't want you to know this but the real reason they're pushing 'prefill queue size' is because the big tech firms already own the infrastructure. They've rigged the game. Pre-warmed replicas? That's just a fancy way of saying 'we're forcing you to pay for idle machines so we can keep our monopoly.' And don't get me started on Kserve 0.12 - that's just a Trojan horse for Google's cloud lock-in. You think this is about efficiency? It's about control. Wake up.
saravana kumar
13 December, 2025 - 09:15 AM
Actually, this entire post is overengineered. In India, we run LLMs on shared T4s with 10 concurrent requests and zero autoscaling. We use cron jobs to restart containers every 4 hours. Latency is 1.2 seconds. Cost is $0.003 per inference. Why are Americans spending 6 weeks setting up Prometheus when a simple script and a coffee break do the job? The problem isn't the tech - it's the mindset. Stop overcomplicating. Just make it work.
Tamil selvan
14 December, 2025 - 03:53 AM
I must commend the author for the clarity and depth of this exposition. The emphasis on prefill queue size as a leading indicator is not only technically sound but also operationally prudent. Moreover, the recommendation to begin with a simple 85% threshold and iteratively refine based on observed behavior reflects a mature, systems-thinking approach. For organizations navigating the complexities of MLOps, this framework provides a reliable, scalable foundation - one that prioritizes both user experience and fiscal responsibility without succumbing to premature optimization.
Mark Brantner
15 December, 2025 - 06:51 AM
So let me get this straight… you're telling me I need to spend 3 months setting up Prometheus, HPA, and custom exporters… just to not blow up my budget? And the fix is… to turn on a toggle in Kserve? Why didn't you just say that at the start?? I feel like I just paid $50k for a tutorial that ends with 'just enable the thing.' Also, I typo'd 'slots_used' as 'slots_uusd' and now my scaling is in a loop. Help.
Kate Tran
16 December, 2025 - 04:34 AM
Interesting stuff. I tried scaling on GPU usage for a while and yeah… it was a mess. Queue size made a huge difference. But I’m still not sure about pre-warmed replicas - feels like wasting money. Maybe I’m just cheap. Also, anyone else feel like we’re building a whole new kind of tech debt here? Like… we’re replacing one problem with five new ones?
amber hopman
18 December, 2025 - 01:58 AM
I love how this breaks down the real pain points instead of just throwing around buzzwords. I’ve been using slots_used for our internal chatbot and it’s been a game-changer - latency dropped from 1.8s to 420ms. But I’m curious - has anyone tried combining prefill queue with HBM usage in a weighted scaling policy? Like, if queue > 80% AND HBM > 85%, then scale? Just thinking out loud. Would be cool to see someone test that.
Jim Sonntag
18 December, 2025 - 07:06 AM
Look, I get it - scaling LLMs is hard. But let’s not pretend this is rocket science. I’ve seen teams from Nairobi to Nebraska solve this with less than 10 lines of Python and a cron job. The real issue? People treat this like it’s a sacred ritual. It’s not. It’s a system. You measure, you adjust, you move on. The fact that it takes 12 weeks to implement? That’s a cultural problem, not a technical one. Maybe stop reading whitepapers and just ship something.
Deepak Sungra
18 December, 2025 - 20:34 PM
Okay but what if you’re running on a 2018 MacBook Pro with 16GB RAM and a 3060? Do you just give up? I tried to run a 7B model locally and the prefill queue was always full because my SSD couldn’t load the weights fast enough. So I just turned it off. Now I just copy-paste responses from ChatGPT and call it a day. It’s cheaper. It’s faster. And honestly? My users can’t tell the difference. Maybe the real solution is… not scaling at all.